

Initiative · AI Production Engineering
Beyond Anomaly Detection
True AI-assisted post-mortems for complex legacy .NET applications
Most conversations about AI in production operations start with anomaly detection.
CPU moved outside a threshold. Memory climbed. Request latency changed. A process began consuming more resources than its peers.
Useful-but not especially new.
For a complex legacy application, the expensive part begins after the anomaly is already obvious:
What exactly happened inside the application, why did it happen, and what evidence proves the code change that will prevent it from happening again?
That is the problem Rubicon applies AI to.
Our approach is not another “AI-led anomaly detection” layer. It is an AI-assisted engineering post-mortem built on hard runtime evidence: WinDbg, SOS, process dumps, IIS topology, logs, metrics, source context and human verification.
An anomaly detector says something is wrong.
A real post-mortem needs to explain which process, which threads, which code path, which shared state, which timing condition, and which implementation decision created the failure.
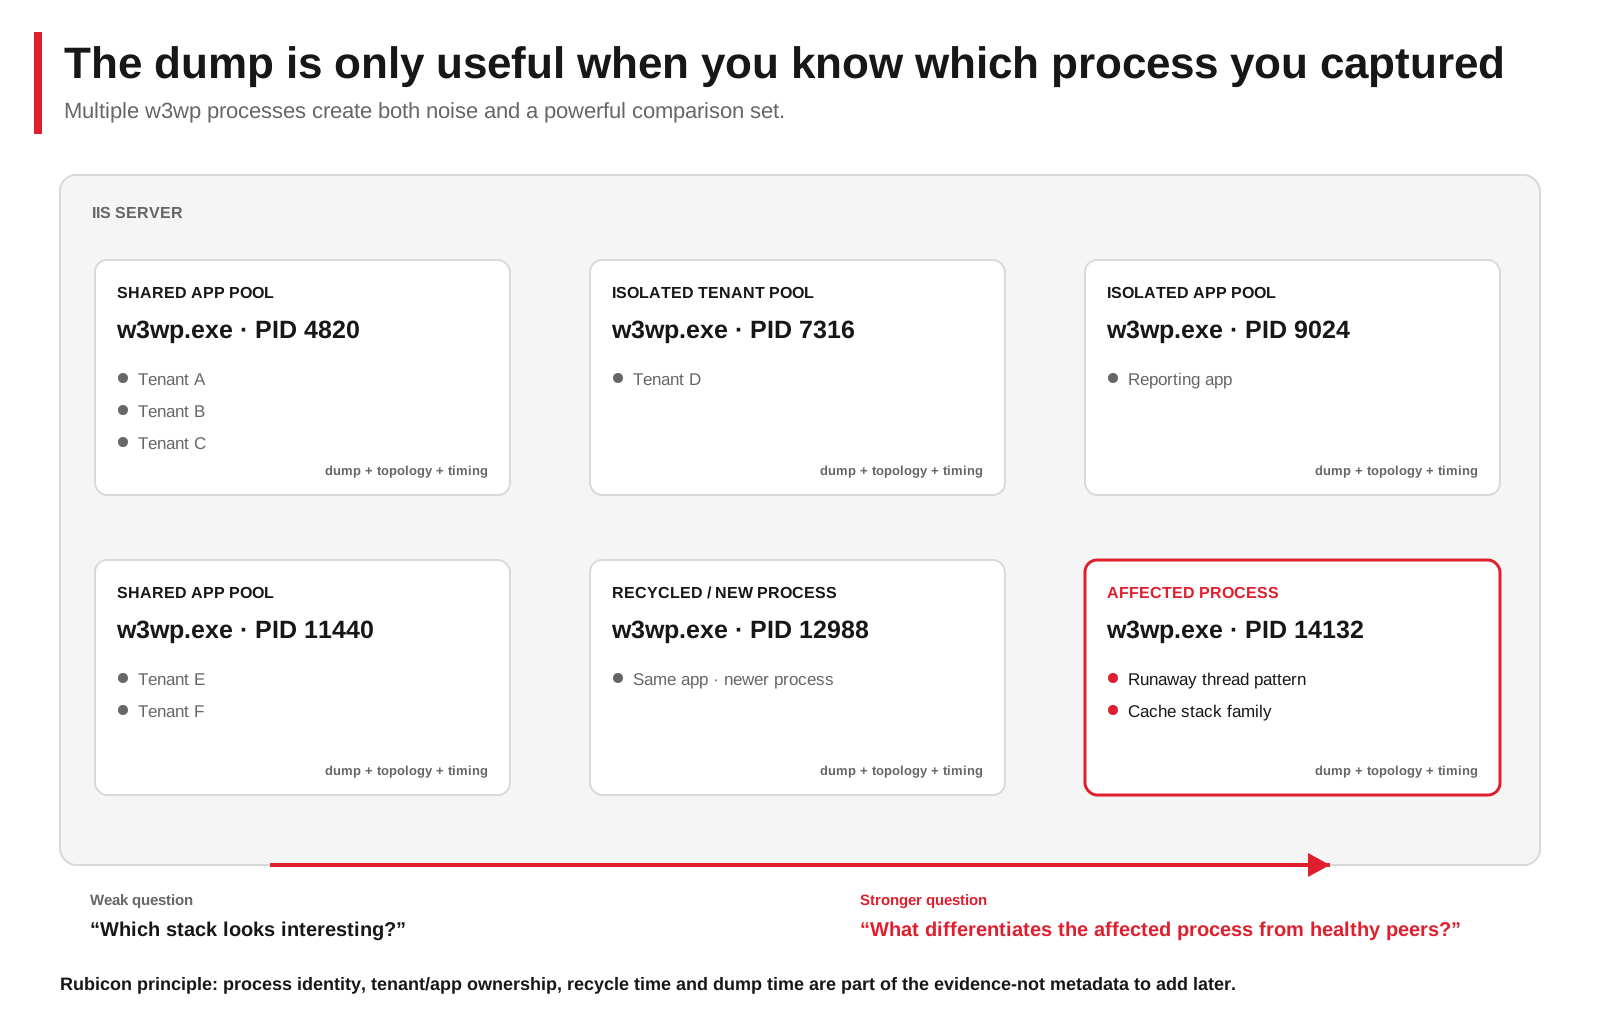
The environment: one server, many realities
Legacy ASP.NET environments are rarely one clean process serving one clean application.
A production IIS server can have multiple w3wp.exe worker processes at the same
time. In our environments, some application pools are shared while others are isolated by
tenant or by application. The same codebase may therefore exist simultaneously in several
runtime contexts with different traffic, cache state, process age and tenant-specific
activity.
That immediately creates a troubleshooting problem:
- Which w3wp.exe process is responsible?
- Which application pool owns that PID?
- Is the affected pool shared or isolated?
- Are all tenants affected or only one?
- Is the problematic stack application code, framework noise, GC activity, a downstream wait-or a symptom of something that already happened?
- Did the process recycle between the beginning of the incident and dump capture?
- Does the dump show the cause, or only the state left behind by the cause?
The topology is part of the evidence.
Why traditional dump analysis can take days
A production dump is extremely valuable because it preserves runtime state. It is also noisy.
The traditional workflow is methodical:
- identify the correct worker process or processes;
- capture one or preferably several useful dumps;
- load the dump into WinDbg;
- load the correct runtime/debugging context and symbols;
- inspect managed threads and call stacks;
- separate CLR, GC, framework, request and background-thread noise from application-specific work;
- group repeated stack signatures;
- inspect synchronization, lock ownership, thread-pool behavior and relevant heap state;
- map suspicious frames back to source;
- correlate the dump with application logs, server metrics, deployment timing and process history;
- form a hypothesis;
- disprove competing hypotheses;
- reproduce or verify the cause in code.
None of these steps is conceptually mysterious. The cost comes from volume and context.
A large process can contain many threads. Several worker processes may need to be inspected. Framework stacks repeat everywhere. The same method may be harmless in one context and causal in another. A dump captured ten minutes after the incident began may show a very different state from a dump taken during the first thirty seconds.
Experienced engineers become effective at filtering this noise, but applying that expertise manually across a large evidence set can consume days. For intermittent production-only issues, the calendar time can stretch into weeks.
The second problem: a dump is late by definition
Consider a common timeline:
- T0 - incident begins;
- T+5 - operations notices symptoms;
- T+10 - the correct process is identified;
- T+12 - a full dump is captured.
By then, the initiating code path may have finished. Threads may now be blocked downstream. A cache may already contain problematic state. A queue may have grown. The hottest stack at dump time may be a consequence rather than the cause.
A dump is therefore evidence of runtime state at capture time-not a video recording of the incident.
This is why a good post-mortem cannot simply ask, “What is the busiest thread?” It must construct a causal narrative from several types of evidence:
- process identity and start/recycle time;
- repeated and unusual stack signatures;
- synchronization and lock state;
- thread-pool state;
- targeted object/cache state where relevant;
- application logs before and after the symptom;
- infrastructure metrics;
- source code and recent changes;
- preferably, multiple dumps taken at intervals.
AI is unusually useful here because the problem is less about discovering one magic debugger command and more about synthesizing a large, repetitive and partially time-shifted evidence set.
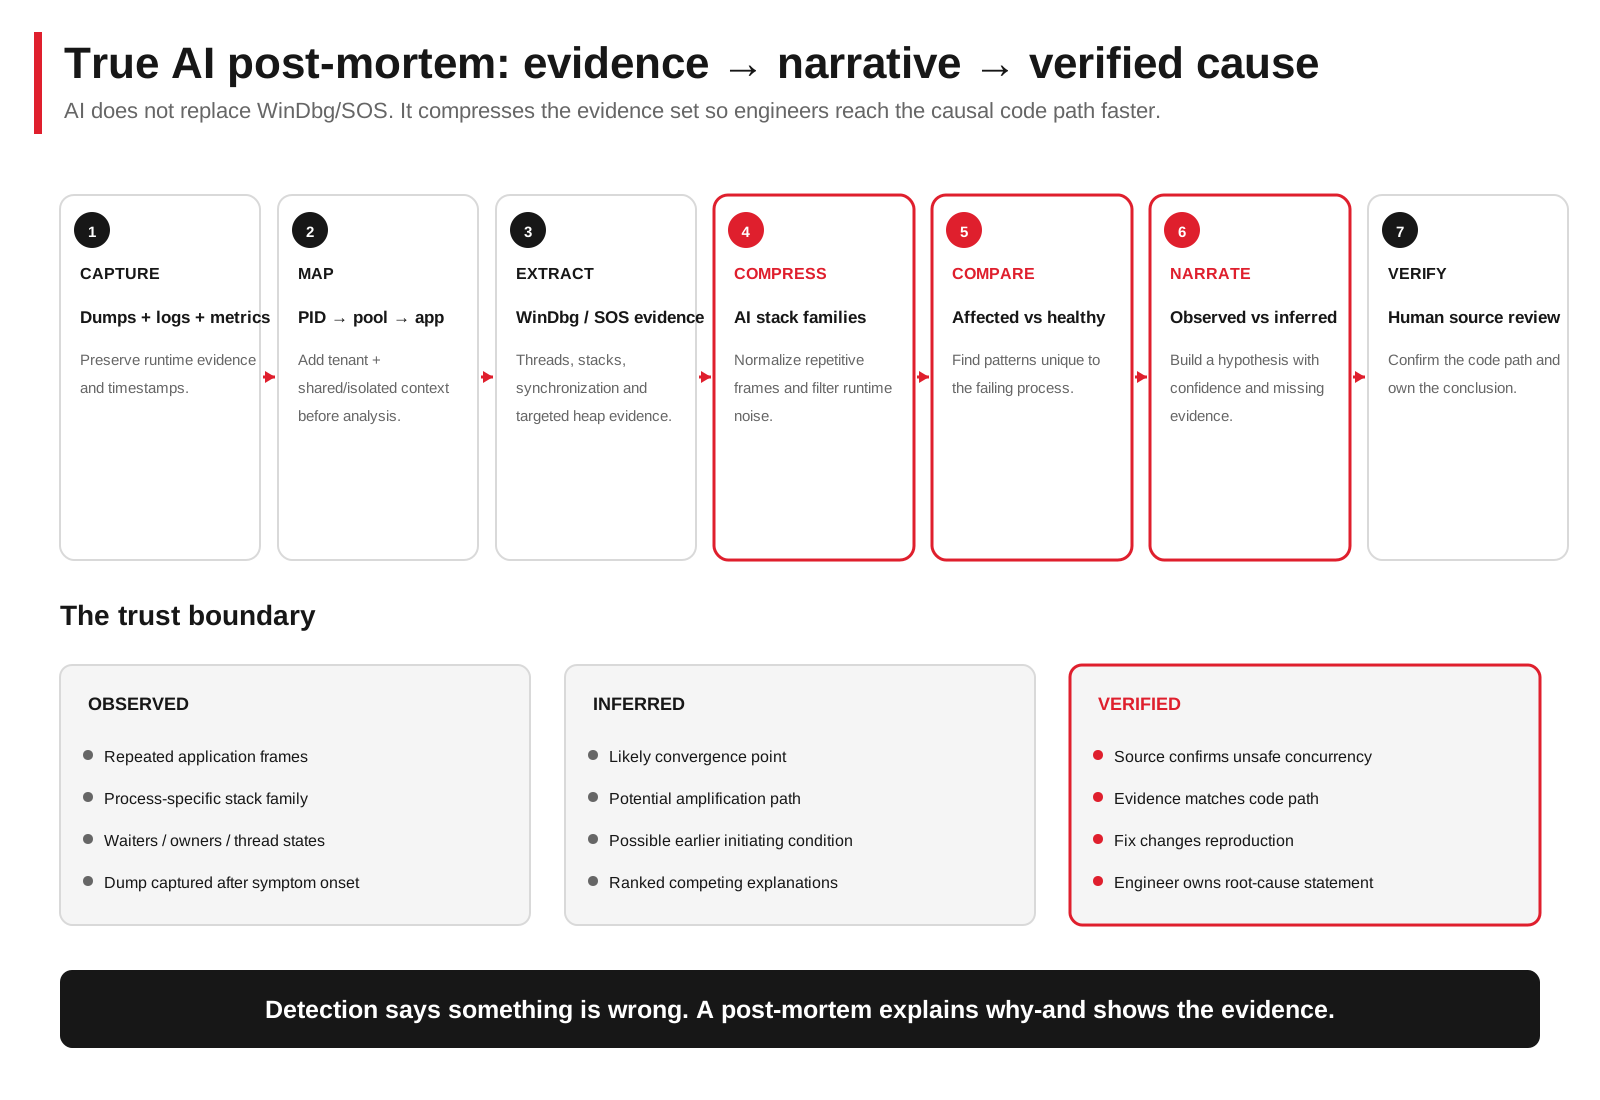
What AI changes
We do not ask AI to replace WinDbg or SOS.
WinDbg and SOS remain the instruments that expose the evidence. AI changes how quickly that evidence can be reduced into an engineering hypothesis.
1. Build a process map first
Before analyzing stacks, we give the analysis an explicit topology:
- PID;
- application pool;
- application;
- tenant where applicable;
- shared vs isolated process;
- process start time;
- recycle history;
- dump capture time;
- known symptom window.
This prevents the classic mistake of spending hours on a technically interesting process that is not actually part of the incident.
2. Turn thousands of frames into stack families
Instead of reading every thread sequentially, AI can normalize and cluster debugger output into families:
- common ASP.NET request stacks;
- normal CLR/runtime activity;
- GC-related activity;
- idle or expected waits;
- repeated application-specific paths;
- unusually deep or recursive paths;
- synchronization-heavy paths;
- cache-related paths;
- background work that appears only in affected processes.
The engineer can then spend time on the few stack families that differentiate the unhealthy process from healthy peers.
3. Compare affected and unaffected processes
Multi-process environments create noise, but they also create a control group.
If several w3wp processes run comparable application code and only one exhibits
the runaway pattern, AI can compare stack frequencies, thread-state distributions, common
application frames, lock ownership/waiters, process age and tenant-specific activity.
The question changes from:
What looks strange?
To:
What is different in the affected process that is not present in otherwise comparable processes?
That is a much stronger troubleshooting question.
4. Separate observation from inference
A trustworthy AI post-mortem should explicitly distinguish three levels.
Observed
- 47 threads contain the same application frame.
- The affected process has a stack family absent from peer processes.
- A synchronization object has a large waiter population.
- The dump was captured 11 minutes after the first CPU spike.
Inferred
- The repeated application path is likely amplifying work rather than merely waiting on it.
- The cache implementation is a likely convergence point.
- The current blocked state may be downstream from an earlier concurrency error.
Verified
- Source inspection identifies unsafe multi-threaded access.
- The code path matches the runtime evidence.
- Changing the implementation removes the runaway pattern under reproduction or controlled testing.
AI is valuable in the first two stages.
Humans must own the third.
A recent case: the problem really was in our code
One recent investigation involved a legacy .NET ASP.NET application running in a complex IIS topology with multiple worker processes.
The visible symptom was runaway thread behavior in production.
At first glance, many explanations were plausible:
- IIS behavior;
- an overloaded application pool;
- traffic concentration;
- downstream latency;
- database activity;
- thread-pool behavior;
- an external dependency;
- cache pressure;
- or a bug in application code.
The dump contained enough activity to support several superficially plausible stories.
The useful breakthrough came from treating the evidence comparatively rather than reading threads one by one.
AI-assisted analysis helped us:
- establish which worker process actually belonged to the affected execution context;
- cluster managed stacks rather than treating each thread independently;
- remove common framework/runtime noise;
- identify repeated application-specific stack patterns;
- connect those patterns to cache-related code;
- compare the affected process against other worker processes;
- build a concise narrative of what was observed versus what was inferred;
- focus human code review on a very small area.
The final cause was not IIS, not infrastructure and not a mysterious AI-detected anomaly.
It was a real bug in our own multi-threaded cache implementation.
The AI did not “discover the bug” autonomously. It compressed the distance between a noisy production dump and the code that deserved human attention.
That distinction is important.
Old workflow vs AI-assisted post-mortem
Traditional
Dump → debugger → thousands of lines → manual filtering → stack-by-stack reasoning → source search → hypothesis → another dump → another engineer → root cause
For an intermittent production issue, this can take days or weeks because each evidence capture may arrive from a slightly different point in the incident.
AI-assisted
Topology + dumps + structured SOS output + logs + timing → normalization → stack families → process comparison → ranked hypotheses → human verification → root cause
The debugger work does not disappear.
The expensive part-reading, grouping, comparing, remembering and narrating the evidence-changes dramatically.
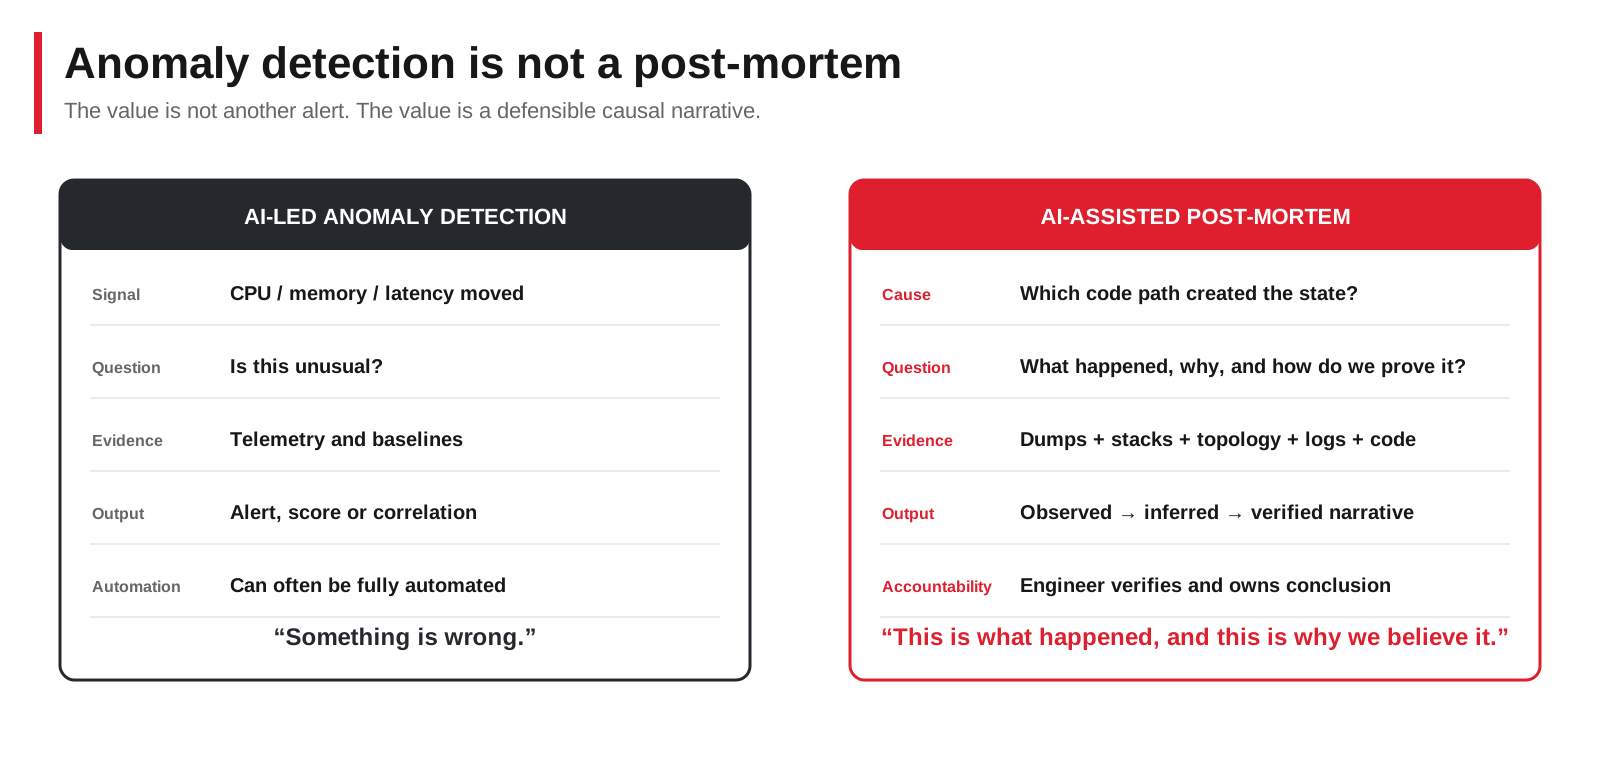
This is not anomaly detection
There is an important difference between operational detection and engineering diagnosis.
| AI-led anomaly detection | AI-assisted post-mortem |
|---|---|
| Detects an unusual metric | Explains a failure after evidence is captured |
| “CPU is abnormal” | “These threads converge on this application path” |
| Usually telemetry-first | Dump-, stack-, topology- and code-first |
| Good for alerting | Good for causal investigation |
| Produces a signal | Produces an evidence-backed narrative |
| May identify correlation | Must distinguish correlation from root cause |
| Can often be fully automated | Requires accountable engineering verification |
We already have monitoring systems capable of telling us that CPU is high.
The harder problem-and the one worth applying AI to-is explaining why.
What “true AI post-mortem” means to Rubicon
We use the term deliberately.
Evidence first
The model does not start with an abstract prompt asking what could cause high CPU in ASP.NET. It starts with evidence from the actual incident.
Context aware
The model receives application topology, process ownership, tenant isolation rules, timing and enough source context to know what the stacks mean in this system.
Comparative
Healthy worker processes, adjacent dumps and previous baselines are used as controls wherever possible.
Explicit about uncertainty
A late dump cannot prove an earlier event that is no longer represented. The analysis must label inference as inference and identify which additional dump, log or reproduction would increase confidence.
Human accountable
AI narrows the search space and builds the narrative. An engineer verifies the code path and owns the conclusion.
The minimum evidence package
For this workflow, we try to preserve a repeatable incident package rather than a loose collection of screenshots and debugger notes.
Process context
- server and environment;
- PID and application pool;
- tenant/application mapping;
- shared or isolated hosting;
- process start/recycle time;
- runtime version;
- dump capture timestamps.
Runtime evidence
Depending on the incident, this may include:
- managed thread inventory;
- managed call stacks;
- synchronization blocks and lock ownership;
- thread-pool state;
- exception information;
- targeted heap statistics;
- selected object roots or object inspection;
- native stacks when required.
Timeline evidence
- first known symptom;
- alert/metric timestamps;
- request/log correlation;
- deployments or configuration changes;
- recycle events;
- dump capture times;
- recovery time.
Code context
Only the relevant source methods, classes, interfaces and configuration are needed for most investigations. The goal is not to send the entire codebase into an AI system. It is to provide enough context to test the hypotheses created from runtime evidence.
Security: the dump is production data
Memory dumps can contain application memory and therefore potentially sensitive production data.
Our rule is simple:
A production dump is not casually uploaded to a public AI service.
Where full-dump AI processing is not explicitly approved, the safer pattern is:
- analyze the dump in the controlled engineering environment;
- export the specific debugger/SOS output needed for the investigation;
- remove unnecessary values and sensitive content;
- provide structured evidence and narrowly scoped source context to an approved AI environment;
- retain human ownership of the final conclusion.
AI should reduce troubleshooting risk-not create a new data-governance problem.
Why legacy systems are a strong AI use case
Legacy applications are often described as the worst place to use AI because they are large, inconsistent and poorly documented.
For post-mortems, those same characteristics create the opportunity.
Legacy diagnosis contains enormous amounts of repetitive expert work:
- compare stacks;
- recognize framework noise;
- match patterns across threads;
- translate method names into a story;
- remember what appeared in a previous dump;
- compare one process to five peers;
- keep track of what is observed, inferred and still unknown.
This is exactly the type of analytical compression where AI can create leverage.
The model does not need to be trusted with the final decision.
It needs to make the right evidence visible to the engineer sooner.
The operating principle
We do not want AI to tell us that production looks strange.
We want it to help answer:
- What was actually happening?
- Where did it originate?
- Which evidence supports that conclusion?
- Which evidence contradicts it?
- What are we still assuming?
- What code should a human inspect first?
- What would prove the fix?
Detection tells us when to look.
The dump tells us what existed.
AI helps turn the evidence into a narrative.
The engineer owns the cause.
That is the model Rubicon is operationalizing.